Happy New Year! We hope that each of you enjoyed the holiday season and wish you the best in the new year. This email will be a little longer than normal since we are going to go over the past market and what that may mean in 2020. We have included several charts from the Real Estate Information Network (our local MLS) to help illustrate the patterns that governed 2019 and what that could mean for the market in the coming year.
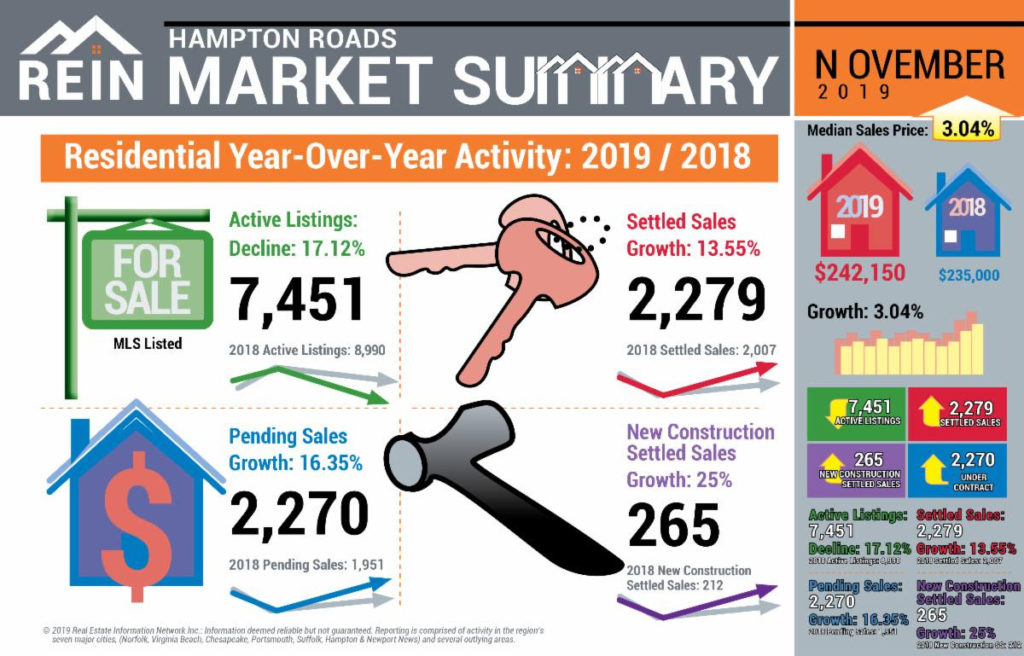
As you can see in the chart below, the number of active listings (homes for sales) continues to go down while the number of homes pending (under contract) and settled sales (homes sold) continues to rise. This chart is based on comparing November 2019 to November 2018 across all the sales in Hampton Roads.
While we are happy to help you with your real estate needs throughout the entire Hampton Roads region, most of our readers are from Suffolk and Isle of Wight so the following charts reflect the numbers from those areas. Each chart is based on monthly numbers over the last five years.
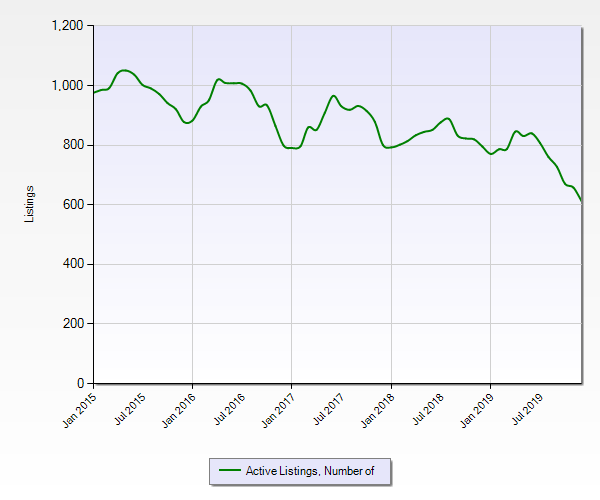
The chart below shows the number of active listings over the last five years. As you can see, there has been a steady decrease with a larger drop occurring over the last year.
This chart is the number of sales, which shows a peak in 2018:
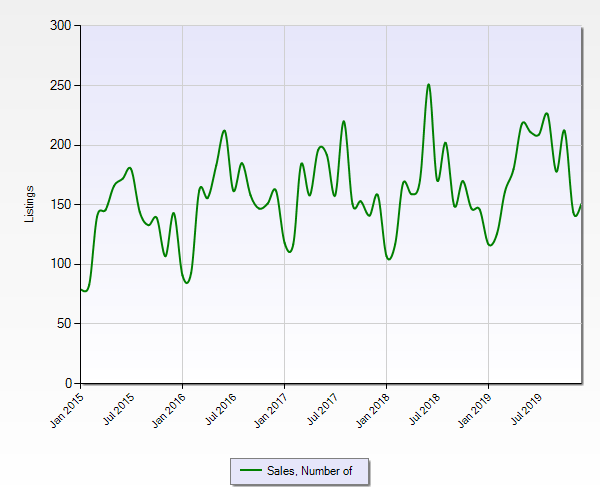
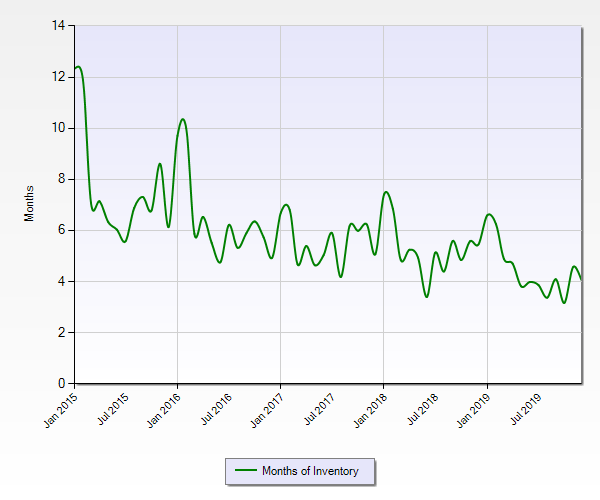
It is our belief that just because more homes were sold in 2018 than 2019 it doesn’t mean sales are slowing down. In fact, the number of days a home is taking to sell went down, and as you can see in this chart, the months of inventory (homes available for sale versus the number of homes that sold that month) is going down. The reason 2018 had more homes actually sell than in 2019 was simply a matter of supply and demand.
The chart below shows the number of homes for sale was less, so buyers had a harder time finding what they wanted.
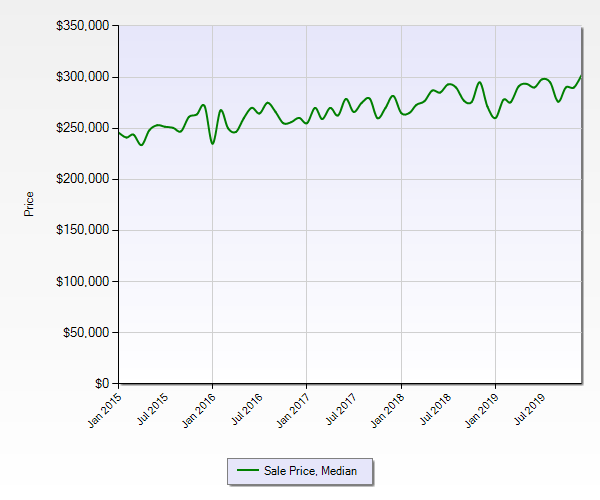
As you can see, Suffolk and Isle of Wright is following the Hampton Roads wide trend of having fewer homes for sale, along with the increase in medium sale price. You will see a large increase in the medium home sale price, but the actual price increase your home may have depends on a lot of other factors. If you are curious about your home, please give us call or reply to this email and we are happy to come out and do a free market analysis on your property.
The chart below shows the medium sale price over the last five years
As for future predictions, for a couple of years we have been saying we are in a glass half full and rising market. This year, when people ask our answer is going to change to the glass is three quarters full and rising. As long as our national economy stays strong and interest rates are decent (they are really good right now – see below for more from Bill Duggan) we think 2020 should be another good year for real estate sales in our local market.
We love talking about real estate, so if you are a member of a group or club and would like us to come talk about the local market we would be happy to arrange a time. Just reply back to this email or give us call.
Happy New Year!
Lee and Harry

