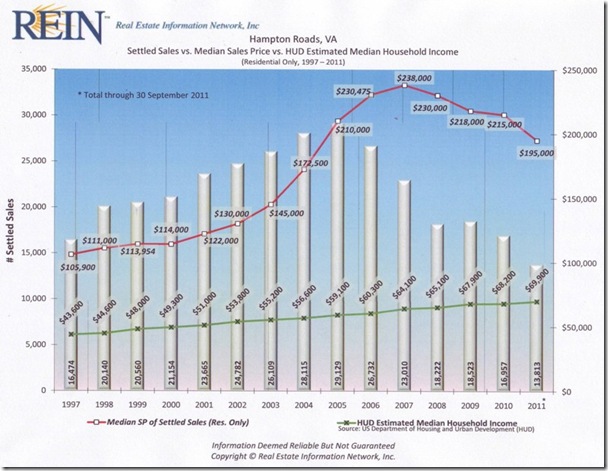
October is one of my favorite months. The leaves turn and the heat is gone. Not much heat in the real estate business. Rates are still great (FHA 4.125/30 yr, Conventional. 3.625/15 yr). The REIN MLS system puts out some great graphs that show what has happened in the market. Below is a graph that shows you the real estate “bubble”, when it happened and what happened. Essentially the local market went from average growth from 1997 to 2001, and then ballooned with an average price going from $122,000.00 in 2001 to $238,000 in 2007. As the market “bubble” burst with the financial crisis and economic downward spiral, the median price came down to $195,000. If you look at Supply of Listings and Demand for those Listings, you get the same picture and same effect. Looks like we may not be completely through with a downward trend. It is all about the economy and jobs. I doubt this Congress can get its act together to help stabilize the economy. If a seller understands where to price their home, it will sell. We know where that is, call us.


